Chartify | Transform Your Data with AI Insights
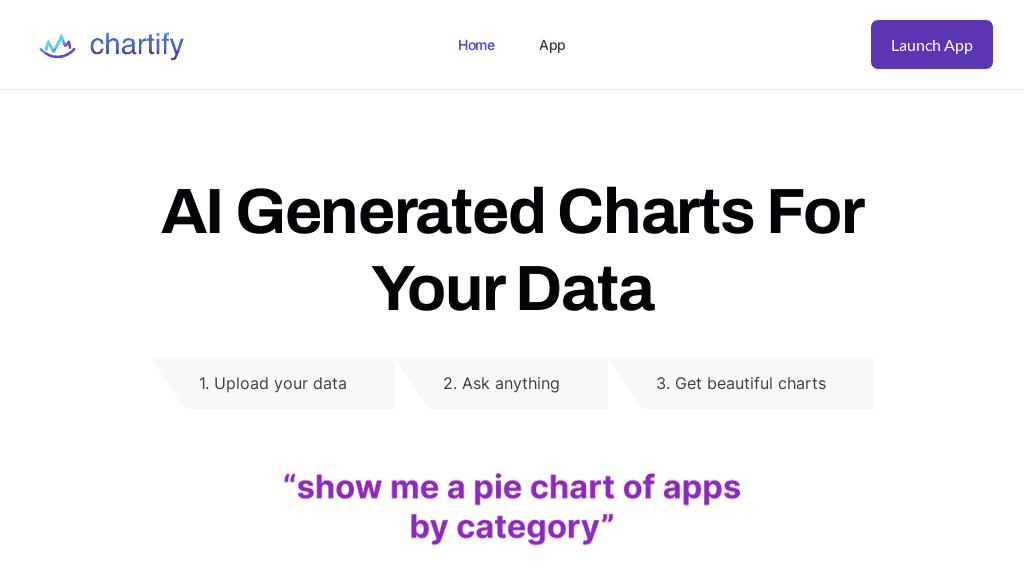
Transform your data into engaging charts and graphs with Chartify! Create interactive visuals like pie charts and line…
- Upvote:
- Failed Startup
Transform your data into engaging charts and graphs with Chartify! Create interactive visuals like pie charts and line…

Chartify is an innovative online tool that simplifies data visualization. Users can easily upload CSV files or connect to databases like Postgres or MySQL. Once the data is uploaded, Chartify leverages AI to recommend various visualization options, making it a breeze to create insightful charts without the hassle of traditional chart editors or coding. It supports popular libraries such as Plotly, Matplotlib, Seaborn, and Charts.js, ensuring versatility in chart types and styles.
AI-Powered Recommendations: Instantly suggests the best visualizations based on the uploaded data.
Multiple Data Sources: Users can upload CSV files or connect directly to databases like Postgres and MySQL.
Wide Range of Chart Types: Supports various libraries, offering diverse chart options from simple line graphs to complex scatter plots.
User-Friendly Interface: Designed for ease of use, making data visualization accessible to everyone, regardless of technical skill.
Quick Setup: Get started in minutes without needing extensive setup or configuration.
Interactive Charts: Create dynamic visualizations that allow for deeper data exploration.
Customizable Options: Users can tweak charts to fit their specific needs and preferences.
Collaboration Features: Share visualizations easily with team members or stakeholders.
Real-Time Data Updates: Connect to live databases for up-to-date visualizations.
Comprehensive Support: Offers resources and support to help users maximize their experience.
Business Intelligence: Analyze sales data to identify trends and make informed decisions.
Academic Research: Visualize complex datasets for presentations or publications.
Marketing Analysis: Track campaign performance through engaging visual reports.
Data Storytelling: Create compelling narratives around data for stakeholders.
Financial Reporting: Present financial data in a clear and visually appealing manner.
Project Management: Monitor project progress and resource allocation with visual aids.


Leave a Reply